Fact Sheet of Chile
Embassy of India
Santiago
Chile: Factsheet
|
General |
|
|
Official Name |
Republic of Chile (रिपब्लिक ओफ़ चिले) Republica de Chile (Spanish)
|
|
Capital |
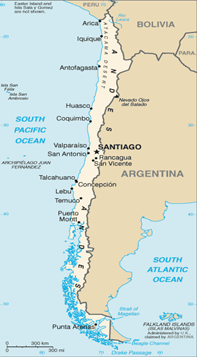
Santiago (सान्तियागो)
|
|
Area |
756,102 sq.kms.
|
|
Weather (in °C) |
Max. 33°C & Min. 16°C [Hottest month, January, 12-29°C; coldest month, June, 3-14°C (average daily minimum and maximum)]
|
|
Population |
20.086.377 (2024) |
|
Forest Cover |
18,333,620 hectares. (24.7% of total area).
|
|
CO2 Emissions |
4.4 metric tones per capita (2020)
|
|
Tourist Arrivals (Year) |
2,389.414 (2024)
|
|
Age Profile |
0-14 years: 20.05% (Source: National Statistical Institute of Chile)
|
|
Life Expectancy |
Overall: 80; Male: 77; Female: 82 (2022) (Source: National Statistical Institute of Chile)
|
|
Languages (with % age of speakers, if available) |
90% of the population speaks Spanish and 10% speak various indigenous languages such as Mapudungun (मापुदुङून्), Quechua (केचुआ), Aymara(अय्मारा) and Rapa Nui (रापा नुई), in addition to Spanish.
|
|
Ethnic Groups |
Roughly 89% of the population is non-indigenous, representing mainly people of European ancestry and some Asian and Arab nationalities. Till very recently, African and Caribbean ethnicity were virtually non-existent in Chile. The remaining population is comprised of various ethnic groups such as the Aymara (0.7%), other indigenous groups (1%) (includes Rapa Nui, Likan Antai (लिकान् अन्ताई), Quechua, Colla (कोईया), Diaguita (दीयागीता), Kawesqar(कावेस्कार्), Yagan (यागन्) or Yamana(यामाना), unspecified (0.3%), with the largest (around 5%) being the Mapuche. (2016 estimate).
|
|
Main Religion (with %, if available) |
Roman Catholic (66.7%), Evangelical or Protestant (16.4%), Jehovah’s Witnesses (1%), others (3.4%), none (11.5%), unspecified (1.1%). (2012 estimate).
In the latest census, religion was not part of the census questions, hence updated information is not available.
|
|
Internet Penetration |
Fixed Fixed Internet accesses reached 4.52 million (Internet penetration was 22.6 accesses per 100 inhabitants) and mobile accesses reached 22.55 million (Internet penetration reached 112.2 accesses per 100 inhabitants) (Source: Vice Ministry of Telecommunications)
|
|
Mobile Phones |
Mobile telephony penetration reached 133.4 subscribers per 100 inhabitants. (Source: Vice Ministry of Telecommunications).
|
|
Urbanization |
The vast majority of Chileans live in urban cities (88%), mainly in Santiago, Valparaiso (वल्पराइसो), Concepcion (कोन्सेप्सियोन्), Iquique (इकीके). The remaining population resides in rural areas (12%) (2020). (Source: National Statistics Institute of Chile and World Bank)
|
|
ECONOMIC |
|
|
Currency |
Chilean Peso (चिलेयन् पेसो)
|
|
Exchange rate with US$ & INR |
1 USD = CLP 950.20 (official rate – March 2025) 1 INR = CLP 10.8681 (official rate – March 2025)
|
|
GDP (PPP) |
653.36 billion USD (Source: World Bank, current international) |
|
GDP Growth Rate |
-6.1% (2020), 11.3% (2021), 2.1% (2022), 0.2% (2023) (Source: World Bank, current international) 2.5% in 2024 (Source: Central Bank of Chile)
|
|
Major Sectors (% of GDP) |
Services (20.9%),C orporate services (12.6%) , Mining (11.9%), Commerce (9.2%), Manufacturing (9.2%), Construction (5.7%), Agriculture and forestry (3%), Communications (2.5%), Food and hospitality (2%), Fishing (0.5%). (Source: Central Bank of Chile, 2023)
|
|
Unemployment (%) |
10.9% (2020); 9.3% (2021); 8.2% (2022); 9% (2023), 8% (2024) (Source: World Bank)
|
|
Inflation (%) |
3% (2020); 7.2% (2021); 12.8% (2022); 7.6% (2023) (Source: National Statistics Institute, INE)
|
|
GDP Per Capita |
US$ 13,162 (2020); US$ 16,185 (2021); US$ 15,411 (2022); US$ 17.093 (2023) (Source: World Bank, current US$)
|
|
Total Trade
|
US$ 181.323 billion (2024) (Source: Chilean Customs)
|
|
Exports |
US$ 101.814 billion (2024) (Source: Chilean Customs)
|
|
Imports
|
US$ 79.508 billion (2024) (Source: Chilean Customs)
|
|
Balance of Trade |
US$ 22.305 billion (2024)
|
|
Major Trade Partners |
Major export partners: China, United States, Japan, South Korea, and Brazil. Major import partners; China, United States, Brazil, Argentina, and Germany (2024) Source: Customs Office. [India was the 11th largest trade partner of Chile in terms of Chile’s exports and the 11th largest trade partner of Chile in terms of Chile’s imports in 2024] (Source: Vice Ministry of Trade)
|
|
Bilateral Trade |
US$ 1969.10 mn (2019-20); US$ 1475.60 mn (2020-21); US$ 2553.08 mn (2021-22); US$ 2602.26 mn (2022-23); US$ 2697.04 mn (2023-24) (Source: Department of Commerce)
|
|
India’s Exports to Chile |
US$ 793.43 mn (2019-20); US$ 805.00 mn (2020-21); US$ 1181.92 mn (2021-22); US$ 1166.43 mn (2022-23); US$ 1182.94 mn (2023-24) (Source: Department of Commerce)
|
|
India’s Imports from Chile |
US$ 1175.67 mn (2019-20); US$ 670.60 mn (2020-21); US$ 1371.16 mn (2021-22); US$ 1435.83 mn (2022-23); US$ 1514.1 mn (2023-24) (Source: Department of Commerce)
|
|
Major Items of Export and Import |
India’s exports to Chile – Vehicles Pharmaceutical products Machinery & mechanical appliances Electrical machinery & equip Animal or vegetable fats and oil Organic chemicals Textile articles Articles of iron or steel Articles of leather Wadding, felt and nonwovens
Imports from Chile: Copper and other ores Edible Fruit And Nuts; Peel Of Citrus Fruits Or Melons Inorganic chemicals Pulp of wood, waste & scrap of paper Iron and steel Mineral fuels, mineral oils and products of their distillation Aluminum & articles thereof Oil seeds and oleaginous fruits Paper And Paperboard (Source: Chilean Customs)
|
|
Indian Investments in Chile |
Major Indian companies have a presence in Chile mainly in the mining/metallurgical, pharmaceutical, automotive and IT sectors, through acquisition of Chilean companies/or joint ventures and other collaborations. As per the data of SUBREI, Indian investments till date are about US$ 620 million. (Source: SUBREI).
|
|
Chilean Investments in India |
Chilean investment in India is US$ 118 million. Chilean Financial Institutions have also invested in the Indian financial sector. (Source: SUBREI). |
|
Political |
|
|
Political Structure |
Chile is a unitary Republic and has a democratic Presidential system of government, with universal adult suffrage (age 18 and above) and a bicameral legislature. The President is the HoS and HoG, and is directly elected for a 4-year term. The President cannot be re-elected for consecutive terms but can be re-elected with a gap of 4 years between terms.
Most of Chile’s governments have been coalition governments. In the last general elections in Chile in 2021, Apruebo Dignidad (Approve Dignity) Coalition candidate Mr. Gabriel Boric Font won by a huge margin. He received 55.9% votes, whereas his rival, far-right Mr. Jose Antonio Kast got 44.1% votes.
|
|
Head of State (President) |
H.E. Mr. Gabriel Boric Font (महामहिम श्री गेब्रियल बोरिच फ़ॉन्ट) (Sworn in on 11 March, 2022)
|
|
Head of Government (Prime Minister) |
Same as above. |
|
Minister of Foreign Affairs |
H.E. Mr Alberto van Klaveren Stork (महामहिम श्री अल्बेर्तो वैन कलवेरेन स्टोर्क) (from 10 March 2023) |
|
Indian Origin/ PRs/ Indian Students |
Persons of Indian Origin is estimated around 2150 and the number of Indian students is estimated around 25.
|
|
Indian diaspora (composition and any pertinent information that may be of interest) |
The origins of the Indian community in Chile can be traced back to 1905. Currently, it is estimated that there are around 4000 Indians living in Chile of whom 2150 have obtained Chilean nationality. One third of them live in Iquique and the rest are in Santiago, Valparaiso, Vina del Mar and Punta Arenas. The majority are from the Sindhi community who are mainly engaged in business, and who have integrated well with Chilean society. In addition, there is a constant flow of professionals and businessmen as also some skilled and unskilled labour (chefs, masseurs, restaurant workers etc.) from India, working mainly in the ICT and financial services sectors and also in Indian companies represented in Chile.
|
|
Indian Organisations (Bank/PSUs/Govt Organisations/Indian Companies |
TCS, JSW Steel Ltd, Godrej, Evaluserve, Intellect Design, Oracle, Wipro, Ishkan, Dr. Reddy, Seven Pharma, Siron Pharma, MSN Laboratories, Bajaj Auto, Tata Motors, Mahindra, Apolo Tyres, Ashok Leyland, UPL, Sterling & Wilson, Tega Industries, Kalpataru Power Chile SpA, Vega Industries Chile SpA.
|
India-Chile Bilateral Trade Data
Values in US $ Millions
| YEAR | 2019-20 | 2020-21 | 2021-22 | 2022-23 | 2023-24 |
|---|---|---|---|---|---|
| Export to Chile | 793.43 | 805.00 | 1181.92 | 1166.43 | 1182.94 |
| Import from Chile | 1175.67 | 670.60 | 1371.16 | 1435.83 | 1514.10 |
| Total Trade | 1969.10 | 1475.60 | 2553.08 | 2602.26 | 2697.04 |
(Source: DGCIS, India)
India–Chile Bilateral Trade Data (Source: Customs of Chile)
Values in US $ Millions
| YEAR | 2020 | 2021 | 2022 | 2023 | 2024 |
|---|---|---|---|---|---|
| Import from India | 709 | 1246 | 1421 | 1363 | 1244 |
| Export to India | 838 | 1103 | 1690 | 1315 | 2596 |
| Total Trade | 1547 | 2349 | 3111 | 2678 | 3840 |
(Source: Customs of Chile)
The reasons for the small differences in the annual bilateral trade data between India and Chile reported by Indian and Chilean authorities for the last 6 years:
- Firstly, the Indian data is reported as per the financial year from April to March while the Chilean data is reported as per the calendar year. This time difference in reporting could lead to some discrepancies in the data.
- Secondly, the transportation time between India and Chile can be long, which can cause delays in the reporting of trade data. This could also contribute to some differences in the data.
Comparison of bilateral trade of Chile with its major trading partners vis-a-vis India for 2024
CHILEAN EXPORTS SORTED BY COUNTRY
FOB amount in USD million
| Rank | COUNTRY | 2024 | In comparison to India |
|---|---|---|---|
| 1 | China | 37995 | 1464% |
| 2 | United States | 16360 | 630% |
| 3 | Japan | 8198 | 316% |
| 6 | India | 2596 | 100% |
CHILEAN IMPORTS SORTED BY COUNTRY
CIF amount in USD million
| Rank | COUNTRY | 2024 | In comparison to India |
|---|---|---|---|
| 1 | China | 19325 | 1554% |
| 2 | United States | 15190 | 1221% |
| 3 | Brazil | 7536 | 606% |
| 12 | India | 1244 | 100% |
CHILEAN TOTAL TRADE SORTED BY COUNTRY
Amount in USD million
| Rank | COUNTRY | 2024 | In comparison to India |
|---|---|---|---|
| 1 | China | 57320 | 1493% |
| 2 | United States | 31550 | 822% |
| 5 | Brazil | 12193 | 318% |
| 11 | India | 3840 | 100% |